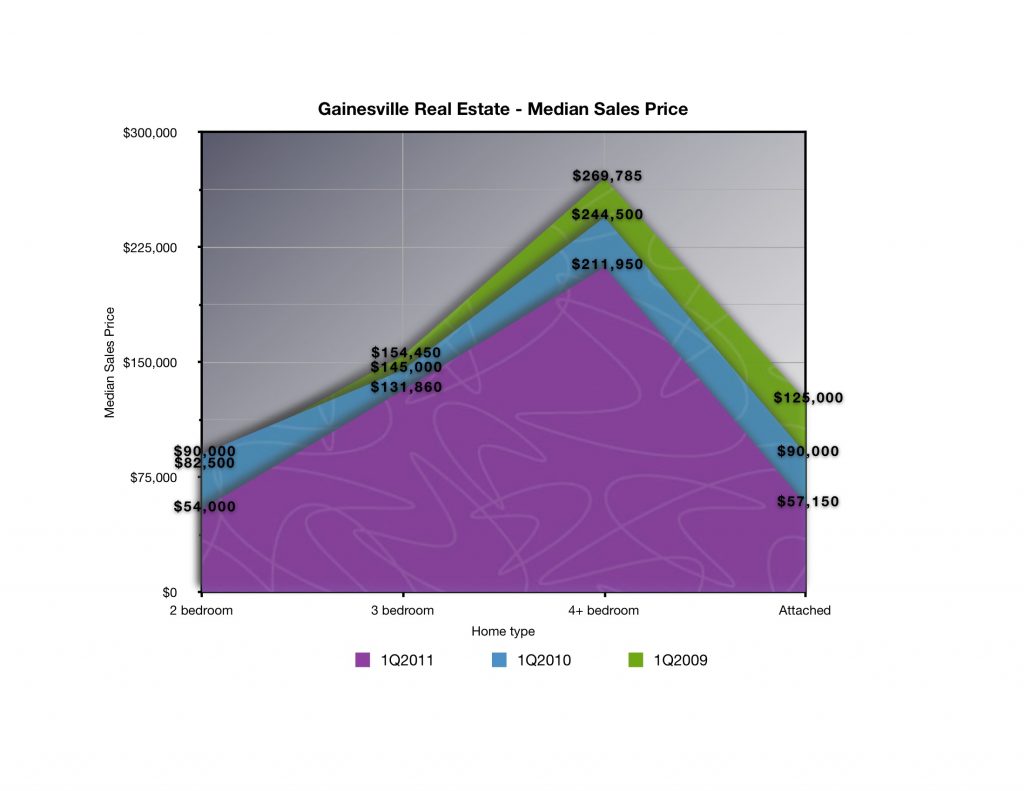
Here’s what is selling in Gainesville FL in 1Q2011. The graph below gives you a quick breakdown of how much homes have sold for in Gainesville FL during the first quarter of 2011, from January 1 through March 31st.
As a basis for comparison, the chart also shows what homes sold for in Gainesville during the first quarter of 2010 as well as the first quarter of 2009.
As you can see, it was much more fun to be a seller in 2009 than it is in 2011.
An article in this week’s Gainesville Sun noted that more properties have sold this quarter than they did this time last year….but that the homes being sold were being sold for less money than they were this time last year. This chart, which uses sales figures gleaned from the Gainesville MLS, confirms that finding.
What is currently on the market
During the first quarter of 2011, 515 homes sold – that figure also includes condos and townhomes.
As of April 24, 2011 the Gainesville MLS shows that 2,627 homes are available for sale – that figure includes condos and townhomes.
What this means for Gainesville home sellers
There is a LOT of inventory out there. If you are selling your home, and you would like to do so in a reasonable amount of time (during the first quarter of 2011 it took an average of 195 days to sell a home), there are two things which you need to do – present your home to buyers in tip-top condition, and price it competitively.
How do you know if your home is priced competitively? Ask your real estate agent for the list of the most recently sold homes in your area, going back no more than 90 days or so. Generally speaking, THAT is where you need to be priced.
Homes that show well and that are priced competitively are the homes which usually end up selling first.
